
When troubleshooting issues with ClickWhale, a WordPress debug log can provide valuable information about what is happening behind the scenes on your website.
Debug logs help identify:
- PHP errors and warnings
- Plugin conflicts
- Theme compatibility issues
- Database-related problems
- Unexpected behavior within ClickWhale
Providing a debug log to the ClickWhale support team can significantly reduce troubleshooting time and help us identify the cause of an issue more quickly.
Before You Start #
Before generating a debug log, we recommend that you:
- Have administrator access to your WordPress website.
- Make sure you can reproduce the issue.
- Update ClickWhale to the latest version.
- Create a backup of your website before making any changes.
What Information Should I Send to Support? #
To help us investigate your issue faster, please include:
- A description of the issue
- Steps to reproduce the problem
- Relevant screenshots or screen recordings
- The debug log file
- ClickWhale version
- WordPress version
- Active theme name
- Relevant plugin versions
Method 1: Generate a Debug Log Using BugTrace (Recommended) #
This is the easiest way to generate and manage WordPress debug logs.
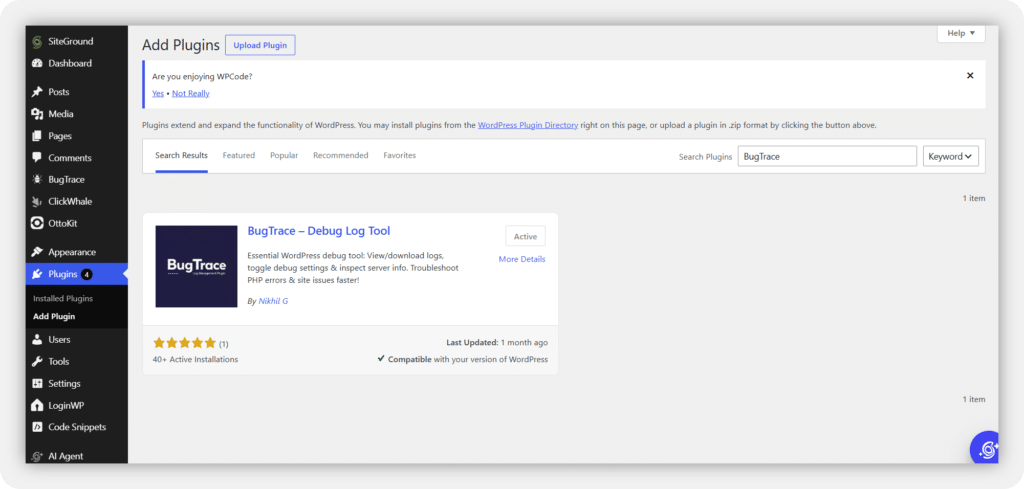
Step 1: Install BugTrace
- Log in to your WordPress Admin Dashboard.
- Navigate to Plugins → Add New.
- Search for “BugTrace”.
- Install and activate the plugin.
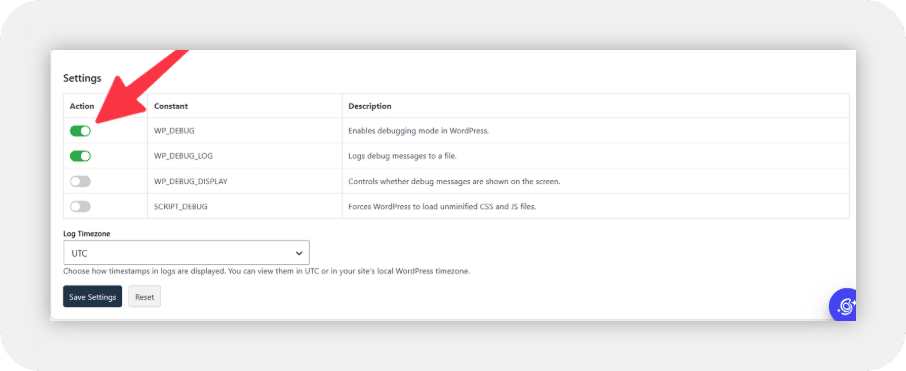
Step 2: Enable Debug Logging
Once installed, BugTrace automatically manages WordPress debug logs and allows you to easily view and download them.
Step 3: Reproduce the Issue
After enabling logging, perform the action that causes the issue.
For example:
- Create a new Link Page.
- Save a Smart Display.
- Test a redirect.
- Visit the page where the issue occurs.
Important: The debug log only captures errors that occur after debugging has been enabled. If the issue happened earlier, reproduce it again to generate new log entries.
Step 4: View the Debug Log
- Go to Tools → BugTrace.
- Open the generated log file.
- Review the latest entries.
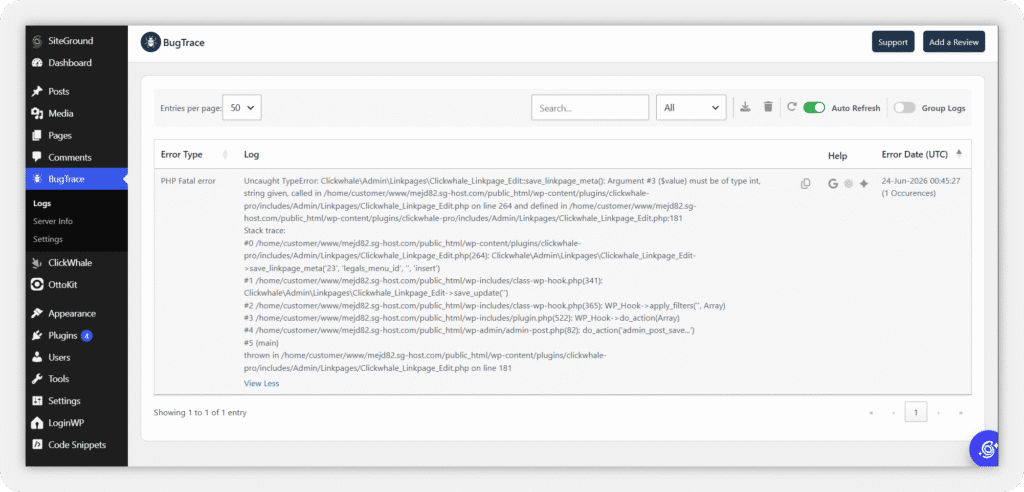
You can:
- Copy individual log entries
- Download the log file
- Clear old logs if necessary
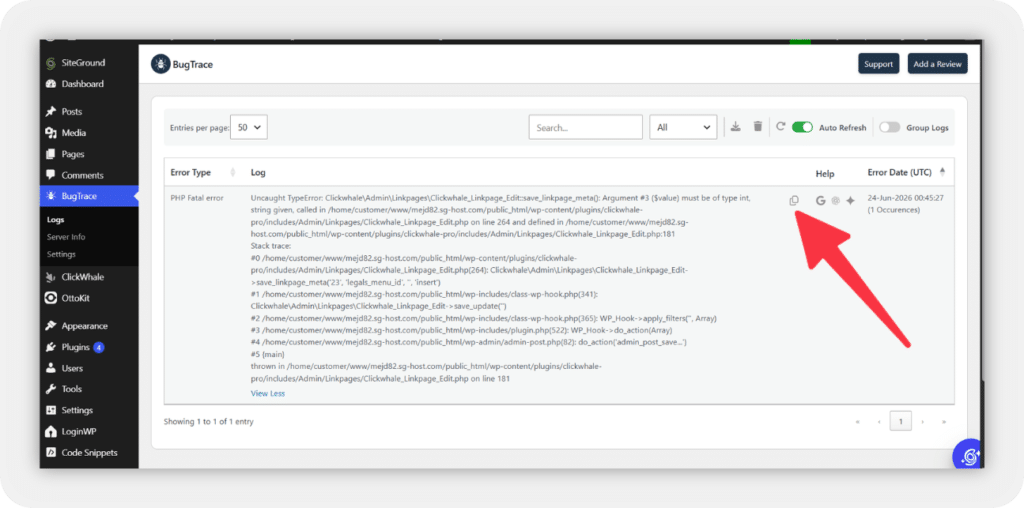
Copying Log Entries
To copy a log entry:
- Highlight the relevant lines.
- Right-click and select Copy.
Or use:
- Ctrl + C on Windows
- Cmd + C on Mac
You can also use the Copy button inside BugTrace.
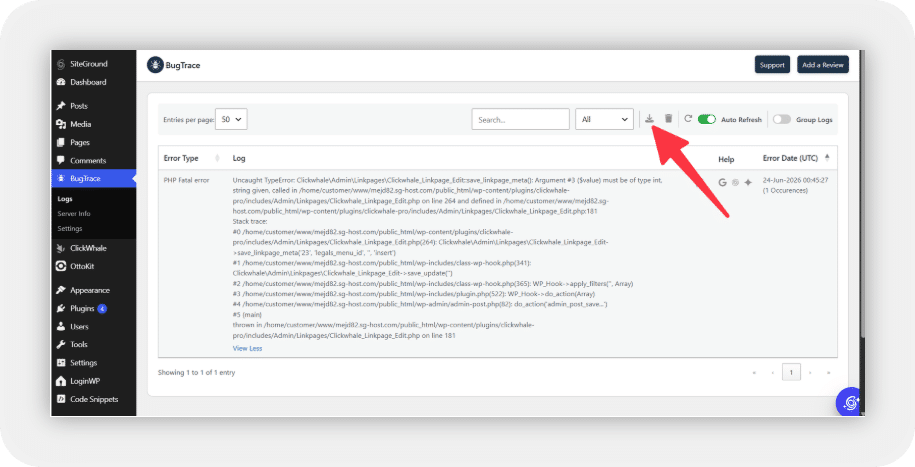
Downloading the Log File
Click the Download button at the top of the interface to download the complete log file.
Step 5: Send the Log to ClickWhale Support
When contacting support, include:
- Description of the issue
- Steps to reproduce it
- Screenshots or screen recordings
- Debug log file
- ClickWhale version
- WordPress version
- Active theme name
- Relevant plugin versions
This information helps our team investigate the issue more quickly.
Method 2: Enable Debug Logging Manually #
If you prefer not to install another plugin, you can enable WordPress debugging manually.
Step 1: Access Your Website Files
You can access your website files using:
- FTP such as FileZilla
- cPanel File Manager
- Your hosting provider’s File Manager
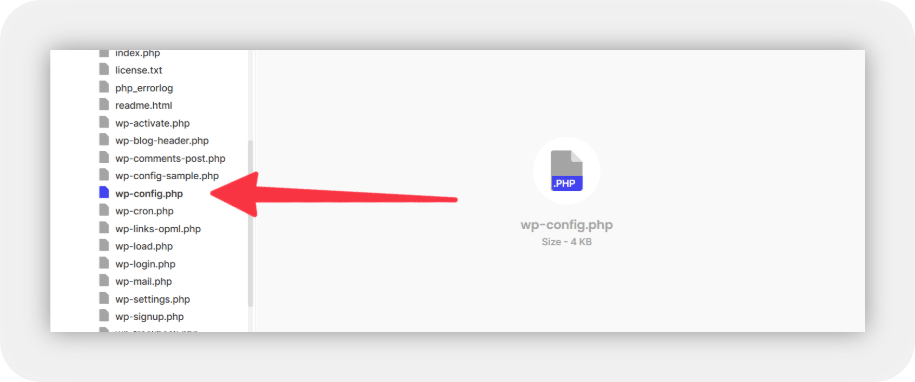
Step 2: Locate wp-config.php
Find the wp-config.php file in the root directory of your WordPress installation.
Step 3: Add the Debug Constants
Open the wp-config.php file and add the following code before:
/* That's all, stop editing! Happy publishing. */Then add:
define( 'WP_DEBUG', true );
define( 'WP_DEBUG_LOG', true );
define( 'WP_DEBUG_DISPLAY', false );
@ini_set( 'display_errors', 0 );
What These Constants Do
| Constant | Description |
| WP_DEBUG | Enables WordPress debugging mode |
| WP_DEBUG_LOG | Saves errors and warnings to a log file |
| WP_DEBUG_DISPLAY | Prevents errors from being displayed to website visitors |
Step 4: Save the File
Save your changes and upload the updated file if necessary.
Step 5: Reproduce the Issue
Repeat the action that causes the problem.
Remember, the log file only records errors that happen after debugging has been enabled.
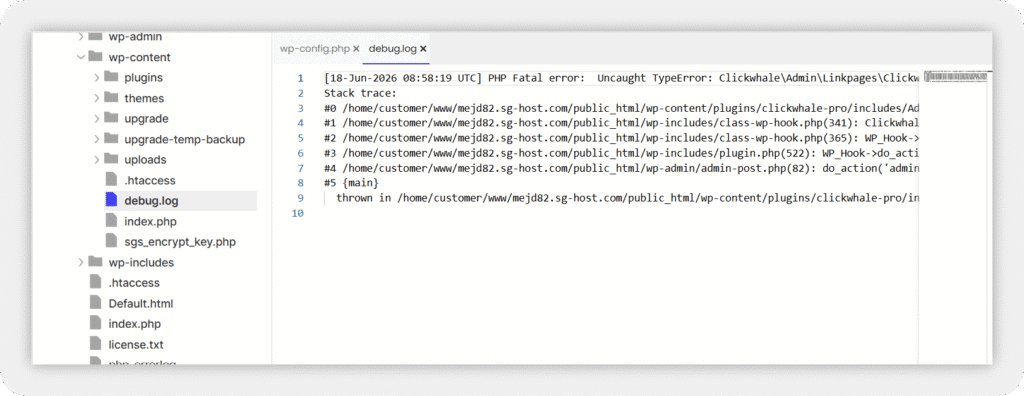
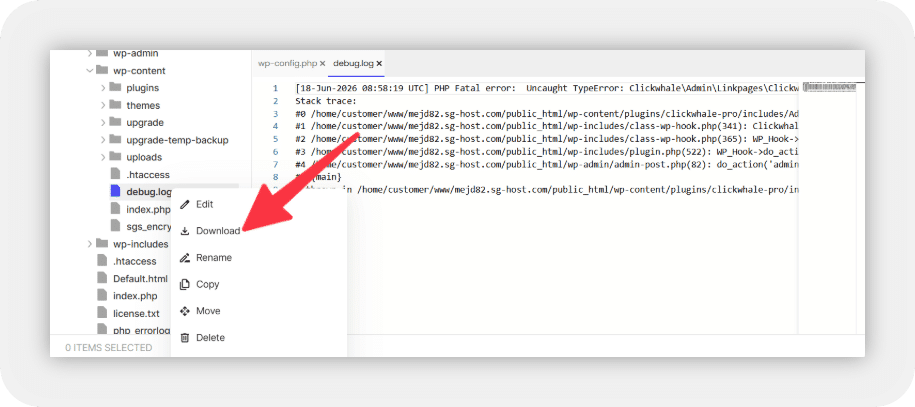
Step 6: Locate debug.log
WordPress will generate a log file at:
/wp-content/debug.logYou can:
- Open the file using a text editor.
- Download it from your server.
- Attach it to your support ticket.
Submit a Support Ticket #
To send the debug log to ClickWhale Support:
- Visit the ClickWhale Contact page.
- Select Technical Support.
- Choose whether you are using the Free or Pro version.
- Provide a short summary of the issue.
- Include detailed steps to reproduce it.
- Enter your website URL.
- Attach the debug.log file or screenshots.
- Click Submit Form.
Once submitted, our support team will review the information and investigate the issue.
Disable Debug Logging After Testing #
Debug logging should only remain enabled while actively troubleshooting an issue.
Once you have collected the necessary information, we recommend disabling debugging to prevent your log files from growing unnecessarily.
Update your wp-config.php file:
define( 'WP_DEBUG', false );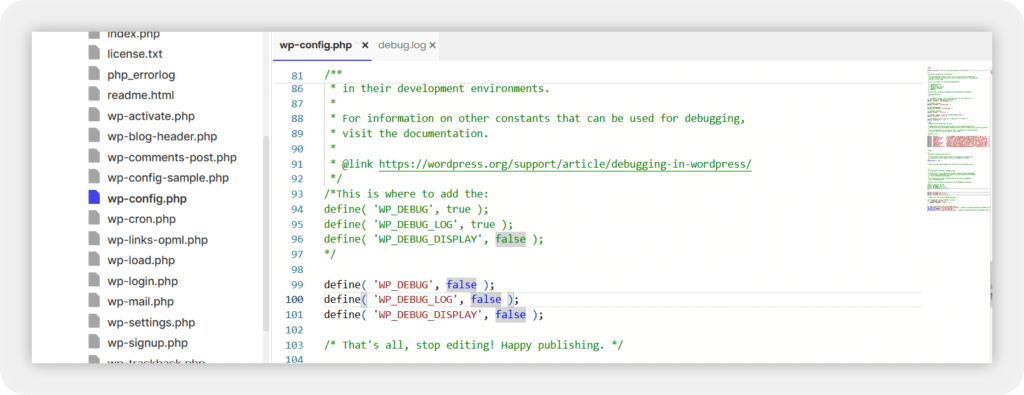
If you are using BugTrace, you can disable logging directly from the plugin settings.
Leaving debug logging enabled for long periods may result in:
- Large log files consuming server storage
- Unnecessary warnings and notices being collected
- Old debugging information making troubleshooting more difficult
Disabling debugging after testing helps keep your website clean and efficient.
Privacy Notice #
Debug logs may contain:
- File paths
- Plugin names
- Technical information about your website
Please review the log before sharing it publicly.
If you are submitting the file directly to ClickWhale Support, you can safely attach the log to your support request.
Common Troubleshooting Scenarios #
Redirect Not Working – Enable debug logging and test the redirect. Review newly generated entries for errors.
Click Tracking Not Recording – Enable logging and click the tracked link. Check the log for tracking-related errors.
Smart Display Not Showing – Generate a log while loading the page where the Smart Display should appear.
Keyword Auto Linker Issues – Enable logging and view the affected post to capture any related errors.
Plugin Conflict Investigation – Reproduce the issue while logging is enabled and review newly generated entries to identify possible conflicts.
FAQs #
Is it safe to enable debug logging?
Yes. Debug logging is commonly used for troubleshooting and can safely be enabled temporarily.
Can visitors see the debug log?
No. When configured correctly using:
define( 'WP_DEBUG_DISPLAY', false );errors are written to the log file instead of being displayed publicly.
Where is debug.log located?
The default location is:
/wp-content/debug.logWhy is my debug.log file empty?
Possible reasons include:
- No errors have occurred yet.
- Logging is not enabled correctly.
- File permissions prevent writing to the log.
- The issue has not been reproduced since enabling debugging.
I enabled debugging, but debug.log does not exist.
Possible reasons include:
- No errors have been generated.
- The issue has not been reproduced.
- Your hosting provider stores logs in a custom location.
- File permissions prevent WordPress from creating the file.
If the file is still missing, please contact your hosting provider.
Which method should I use?
We recommend using BugTrace because it provides an easy interface for enabling, viewing, and downloading logs without editing WordPress files manually.
Need Help? #
If you have generated your debug log and still need assistance, please contact the ClickWhale support team and attach your log file along with the information listed above.
The more information you provide, the faster we can investigate the issue.


